The British Business Bank's 2026 Equity Tracker puts UK smaller-business equity investment in 2025 at £12.3 billion, 4% below the previous year. That modest decline can obscure a more consequential change in the composition of the market. AI companies took 44% of total investment. The ten largest fundraisings accounted for 23%. These measures overlap and should not be added; read together, they explain why the value of completed rounds can look steadier than the experience of companies trying to close one. British Business Bank, Equity Tracker findings
The geography of pounds and the geography of deals
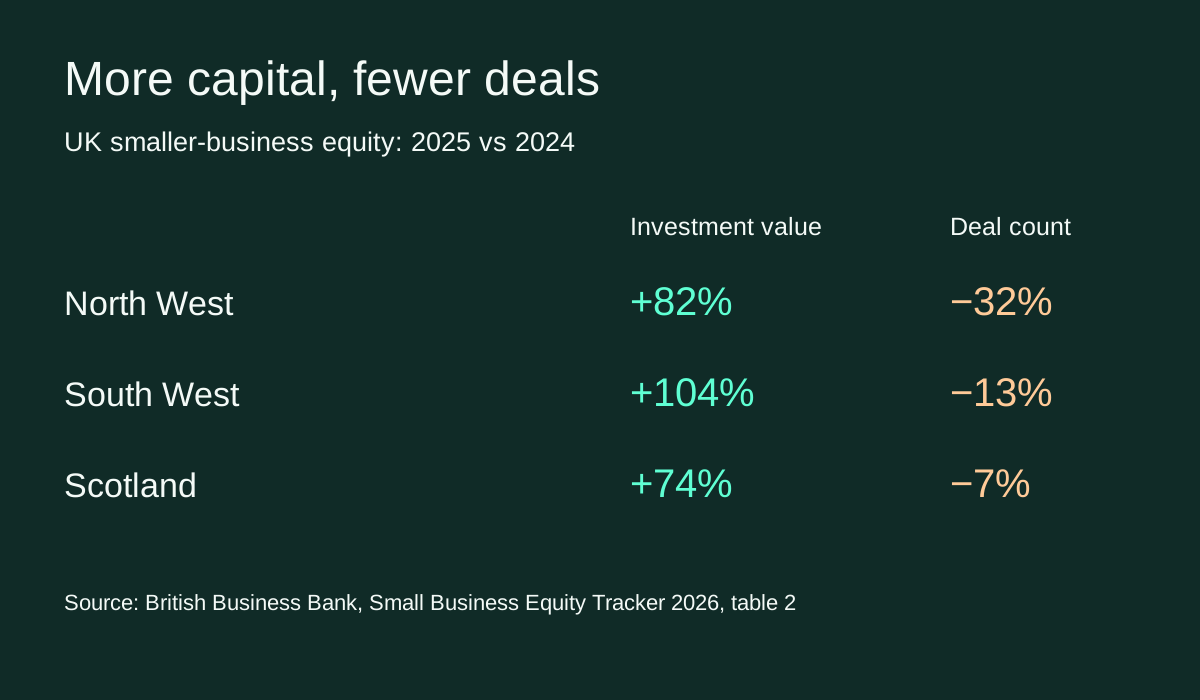
The full-year regional table shows that the three largest gains in investment value came with falling deal counts. In the North West, £1.23 billion was raised across 107 deals: value rose 82%, while the number of deals fell 32%. In the South West, £687 million across 121 deals meant a 104% rise in value and a 13% fall in deals. Scotland recorded £986 million across 197 deals: value rose 74% while deals fell 7%. Yorkshire and the Humber showed the reverse pattern: deal numbers increased 13%, but investment value fell 41%. London's share of UK investment value fell from 60% to 57%; its share of deals moved only from 49% to 48%. Equity Tracker, regional table, p. 43
The earlier Finance Markets report gives a different answer for the North West: investment value fell 70% in its first-three-quarters comparison, against an 82% rise in the full-year Tracker. The reporting windows differ, so the figures should not be spliced together or treated as contradictory. The earlier table also shows the power of individual deals: a £445 million round for Edinburgh-based Fidra Energy represented nearly three-fifths of the £757 million recorded for Scotland in that nine-month snapshot. Finance Markets, figure B.40 and discussion, pp. 110–111
There is a second complication in the stage data. The Bank describes growth-stage investment as resilient while seed and venture deal counts fell by 27% and 13% respectively. This does not establish that the same companies had an easier time raising later rounds. It does suggest an angle worth testing over several years: fewer businesses entering the financed pipeline may alter the mix of companies that reach growth stage later. To test that possibility one would need to follow cohorts, not merely compare the totals from one year.
The companies that never appear in a deal tracker
The Bank's separate 2025 Business Finance Survey interviewed 1,734 smaller businesses and weighted its results to the UK SME population. It asks about demand for finance and businesses' experiences when seeking it. This is useful precisely because an investment tracker starts at the other end of the process, with a deal that happened. The two sources cannot simply be combined to produce a regional rejection rate for growth equity. The survey covers a wider population and forms of finance beyond equity; its UK-wide weighting does not by itself establish that a narrowly defined regional subgroup is large enough to analyse. British Business Bank, Small Business Finance Markets Report 2026 and survey
What would change the story is a comparison of similar firms by stage, sector and location. How many sought equity? How many obtained it, how much did they receive relative to what they sought, and on what terms? How many abandoned the attempt because they expected it to fail? A regional market can record few deals because few firms want equity, because investors reject more of them, or because a better offer is available through debt or retained earnings. These explanations imply quite different policies. A count of completed transactions cannot choose among them.
What to measure next
A practical first test is to compare the regional distribution of deal counts and values by stage, then see how much the picture changes after removing unusually large rounds and separating AI from other sectors. If the change survives, the result is stronger evidence that completed investment has broadened geographically. It still needs a demand-side check before it can be described as improved access. Ideally that check would include firms that sought finance and failed, as well as those discouraged from applying. Without it, a regional gain in capital raised should be described as exactly that.
Britain's smaller-business equity market may be becoming less London-centric in where pounds are booked. Whether it is becoming less London-centric in who gets a credible chance to raise them is a separate question, and the more valuable one.
The regional figures cover announced deals across stages. They do not measure regional acceptance rates for growth-stage deals.